Aquatic Control’s lake mapping services utilize industry standard practices and equipment to collect detailed information about lakes and ponds. The information collected is highly useful to both lake managers and the customer (private owner, property/home owners association, conservancy district) alike. Our mapping service utilize boat mounted SONAR and structure scanning technology to record data for each body of water. The recorded SONAR soundings are processed to provide data on water body characteristics like sediment hardness, vegetation coverage and water volume. Customers may be interested in this service to address a number of lake management goals, questions, or concerns.
Commonly this service is utilized to provide our customer with high resolution water volume information, along with detailed, printed maps of the water body showing 1 or 3 foot contour lines. Water volume accuracy is important as it allows for accurate dosing for certain types of herbicides used in vegetation control. Basic bathymetry maps are also useful in fishery management by allowing the client and manager to identify unique features in the lake where fish may congregate or identify locations where artificial structure can be added to improve habitat. Lake mapping also provides information on vegetation coverage and biovolume. This data is important to customers who are interested in managing a fishery with specific vegetation coverage goals, want to target vegetation management to specific areas of dense coverage or to monitor treatment success throughout a lake. When performed routinely, this service can also provide information over longer periods of time to track sedimentation, or loss of water volume due to sediment/muck accumulation. The mapping service can identify these shallow, sedimented or muck filled areas and direct the customer where to focus potential dredging operations.
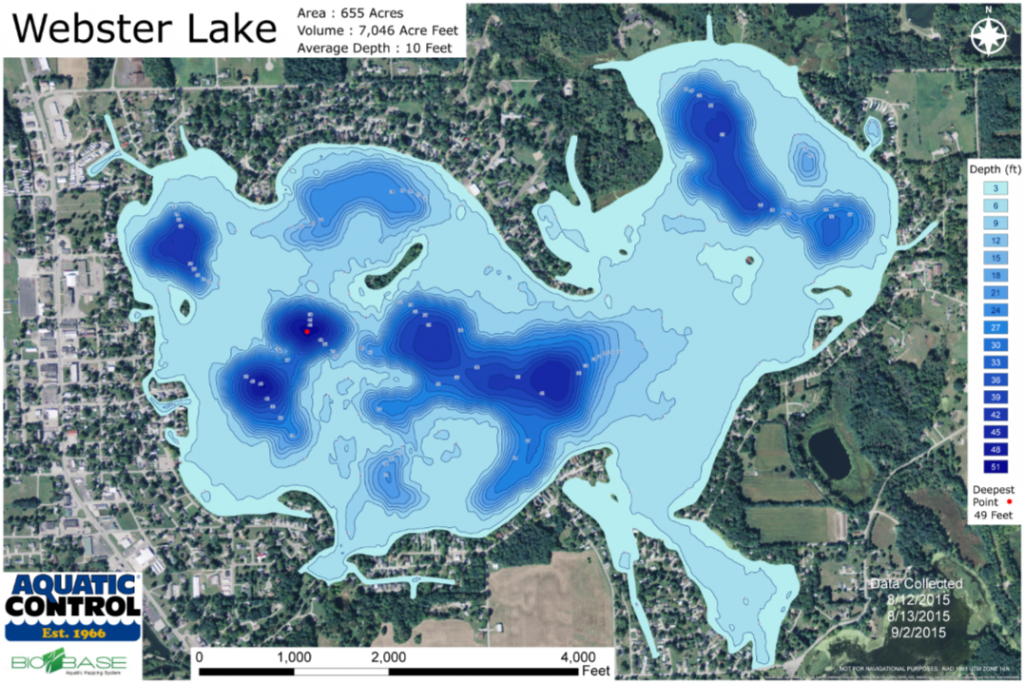
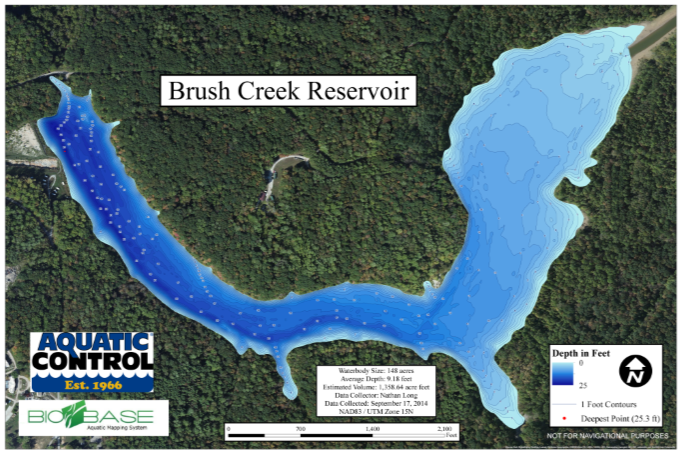
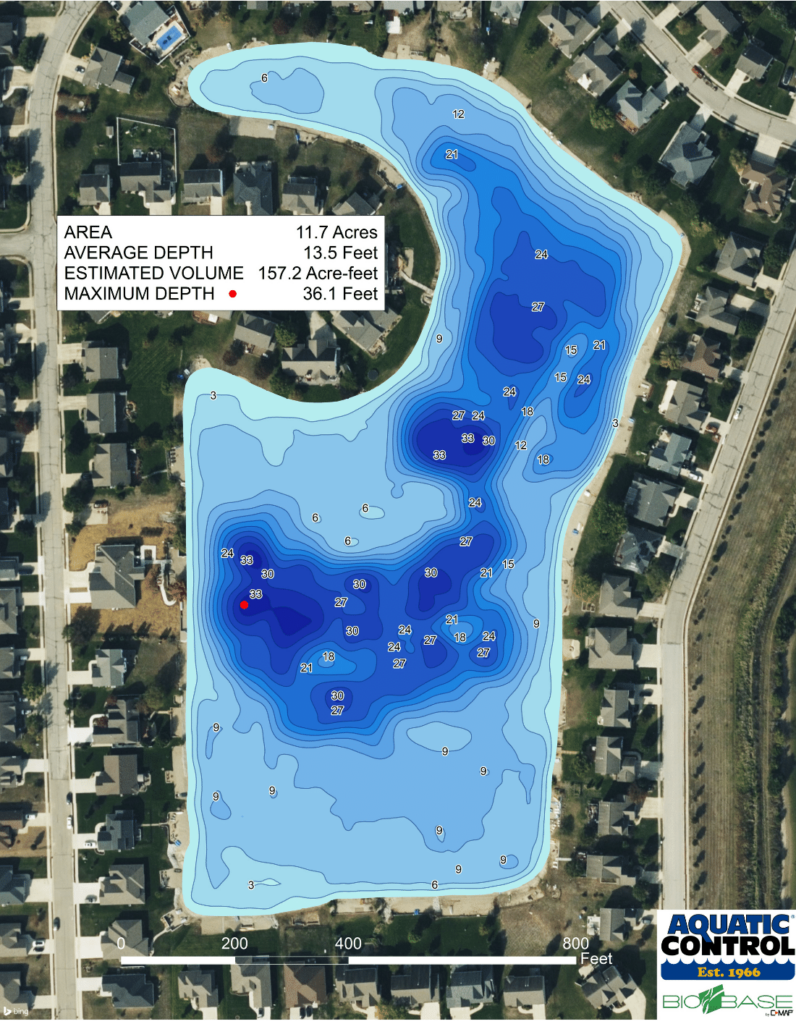
Bathymetry Mapping
This map provides a high resolution (24”x36”, printed and laminated map) showing optimal aesthetics of 1 or 3 foot contour lines depending on necessary amount of detail. The map also featured a red dot designating the deepest point within the lake and a table of waterbody information including: Surface acres, maximum depth, average depth and acre-feet. Color scale of map begins light blue for shallow areas and becomes darker blue with each deeper contour line. Many clients display these maps in association club houses or public areas.
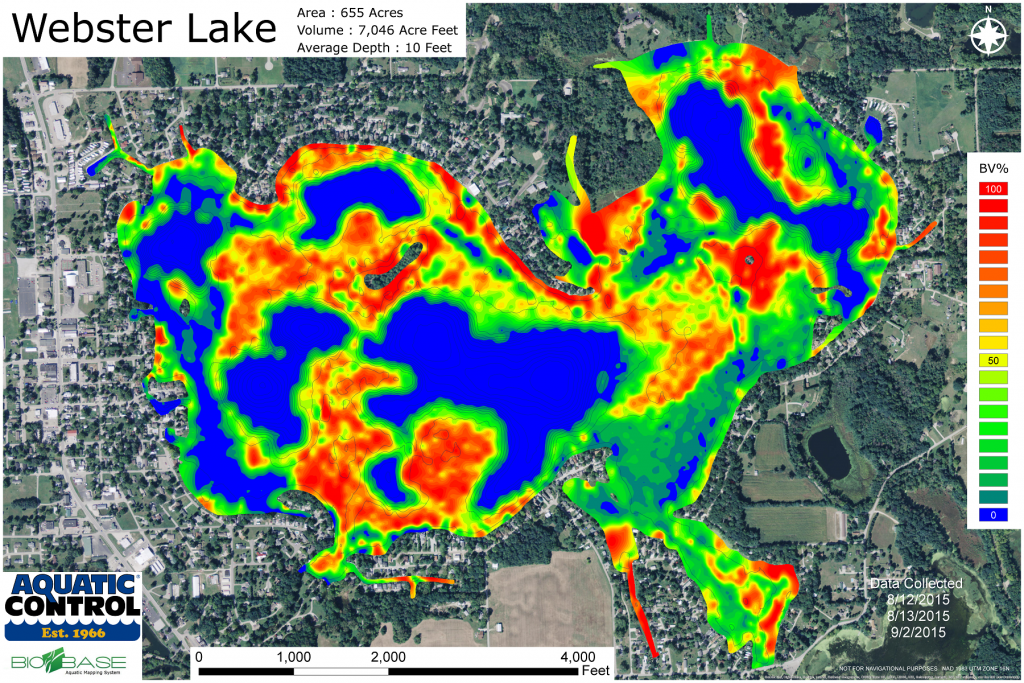
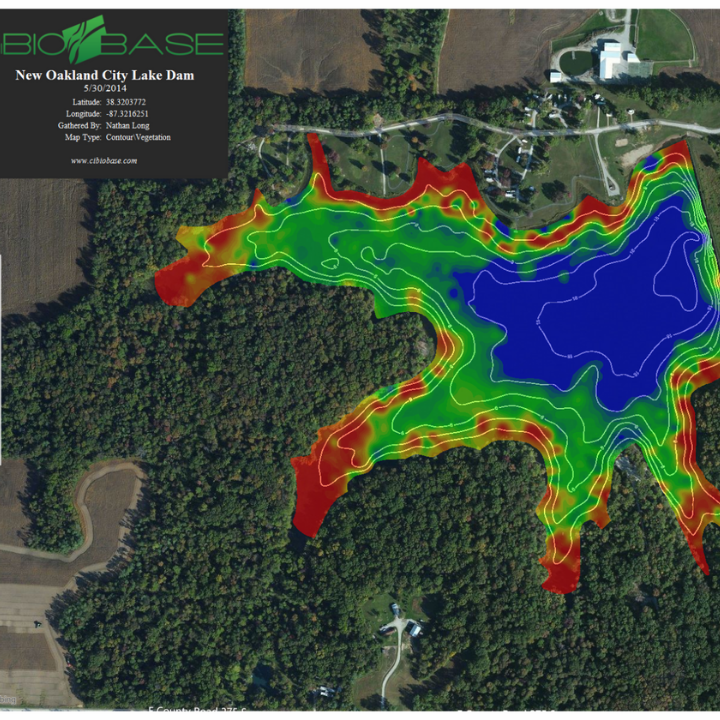
Vegetation Mapping
Usually provided in a digital format within a vegetation management plan report unless print is requested. This map is a density based heat map. Blue areas indicate where vegetation is absent. As vegetation biovolume (volume of water occupied by vegetation) increases color changes from light green at the lowest density to yellow at moderate density and red at highest density.
Lake Mapping Success Story
Randall Melton
★★★★★
Indiana
Our HOA sourced Aquatic Control to do the mapping of the under water land of our 14 acre lake . I cannot put into words the quality of the results we received . Not only for the information they showed but the over all detail of the mapping . I asked the HOA board to give me feedback on the results and every word was pleasing . Extremely pleased with what we received . Thank you so much Aquatic Control
Want to have your lake mapped? Our Aquatic Biologists are here to help. Complete the form.